In 1915 the Wisconsin Experiment Station began a study of Johne’s disease. This tradition continues at the University of Wisconsin to this day. Today’s news post looks at studies in the U.S. that have tried to estimate the herd-level prevalence of this infection for dairy herds, i.e. percentage of MAP-infected herds. Also, because this literature is often hard to access, the original publications from which the graphics below originate, are also provided.
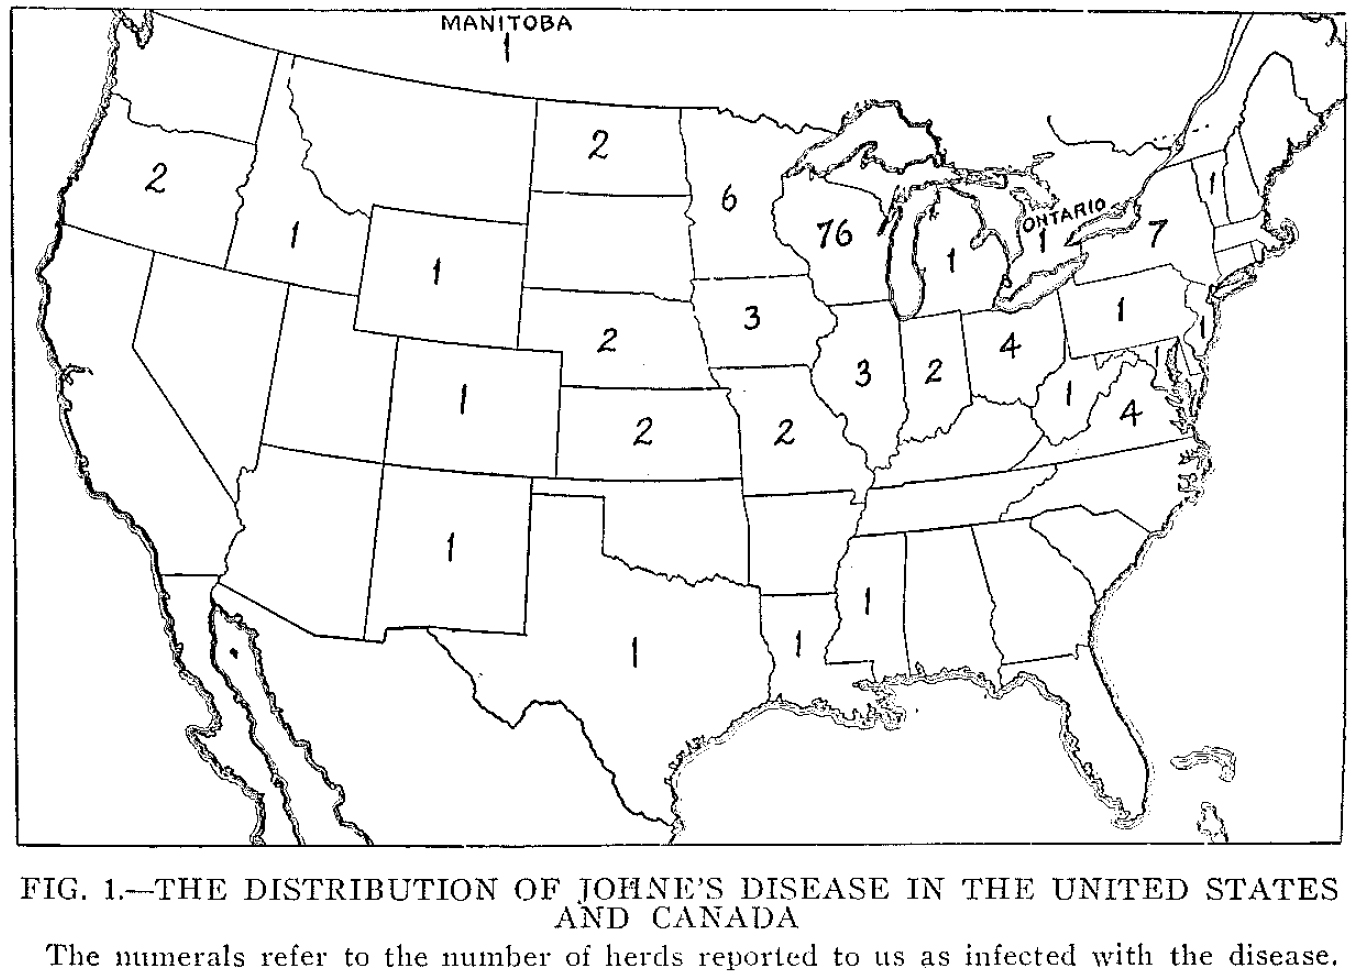
In 1927 Hastings et al. published a 44-page report on Johne’s disease (Wisconsin Research Bulletin 81) with 121 references. In that report, the authors provided a graphic illustrating where Johne’s disease had been reported (below).
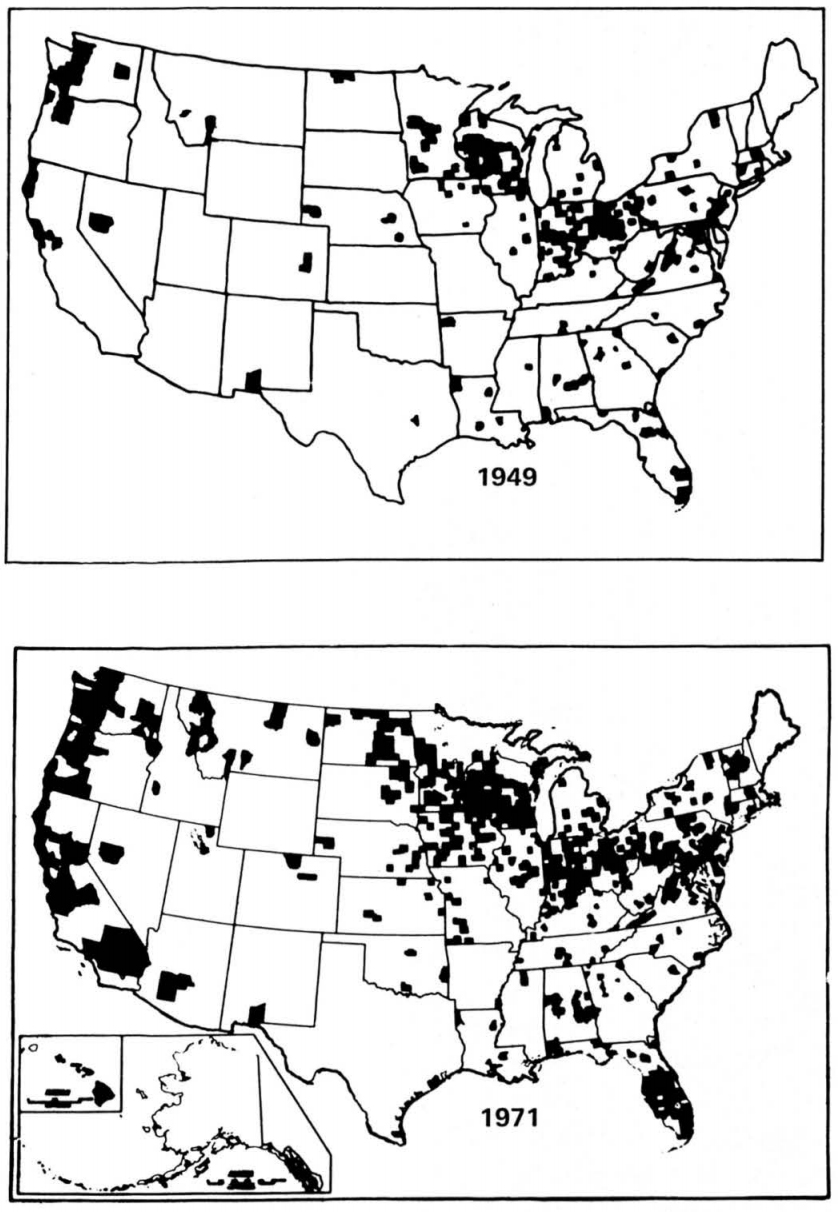
In 1976, at a meeting of the American Association of Bovine Practitioners, Dr. Aubrey Larsen reviewed developments in research on paratuberculosis and provided the results of two U.S. surveys, one in 1949 and one in 1971 (Proceedings of the 1976 AABP meeting).
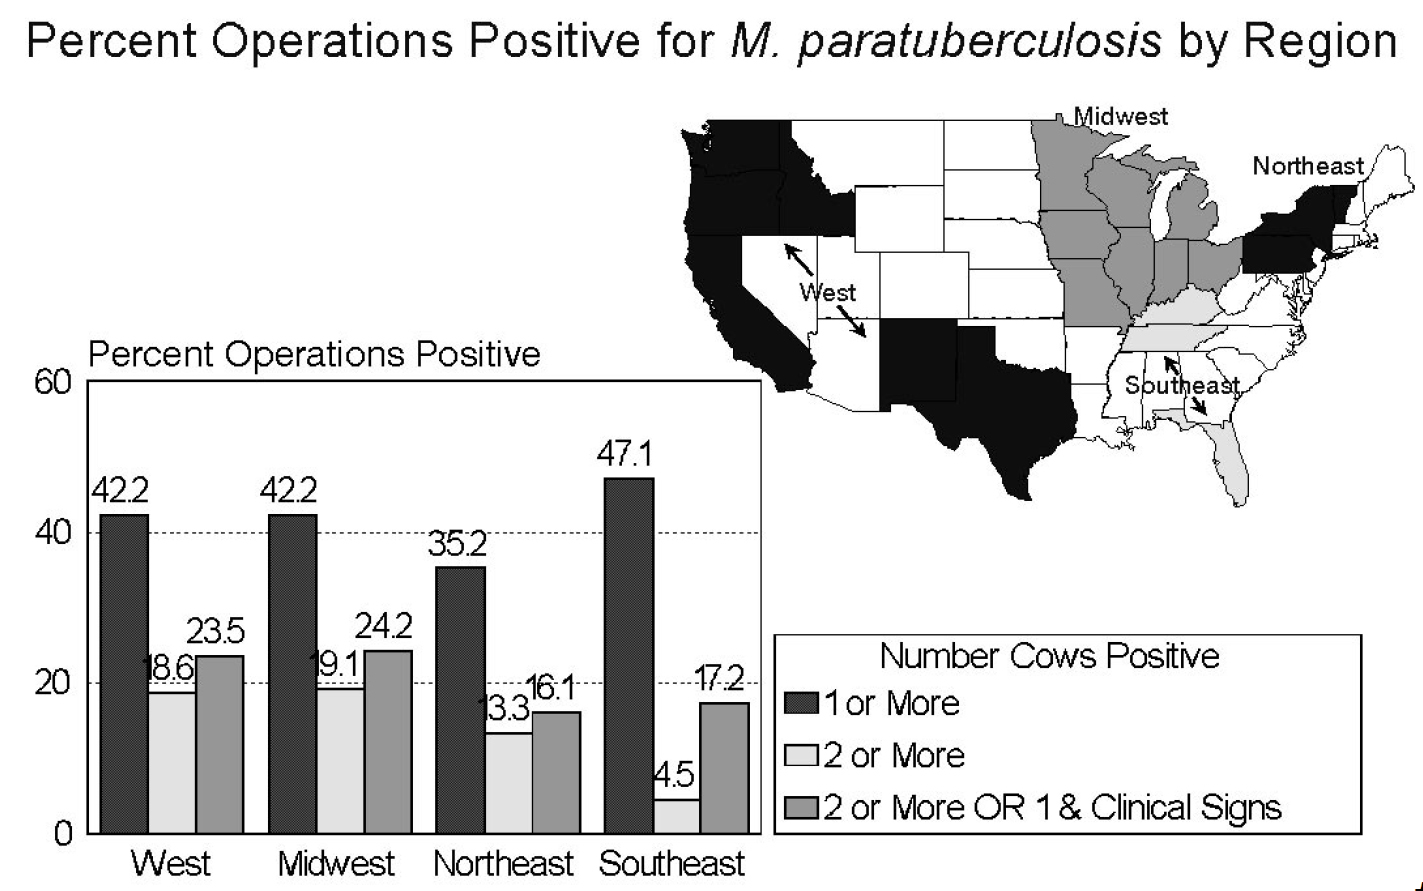
In 1996 the USDA surveyed U.S. dairy herds using an ELISA for serum antibodies against MAP. They used 3 definitions for a “positive”, i.e. MAP-infected herd: 1) herds with 1 or more ELISA-positive cows (40.6% of all herds), 2) herds with 2 or more ELISA-positive cows (16.8% of all herds), and 3) herds with 1 or more ELISA-positive cows and reports of clinical signs of Johne’s disease by herd owners (21.6% of all cows. The 21.6% figure is the one most often cited as herd-level MAP infection prevalence for U.S. dairy herds in 1996. Significant regional differences were only found for the second case definition.
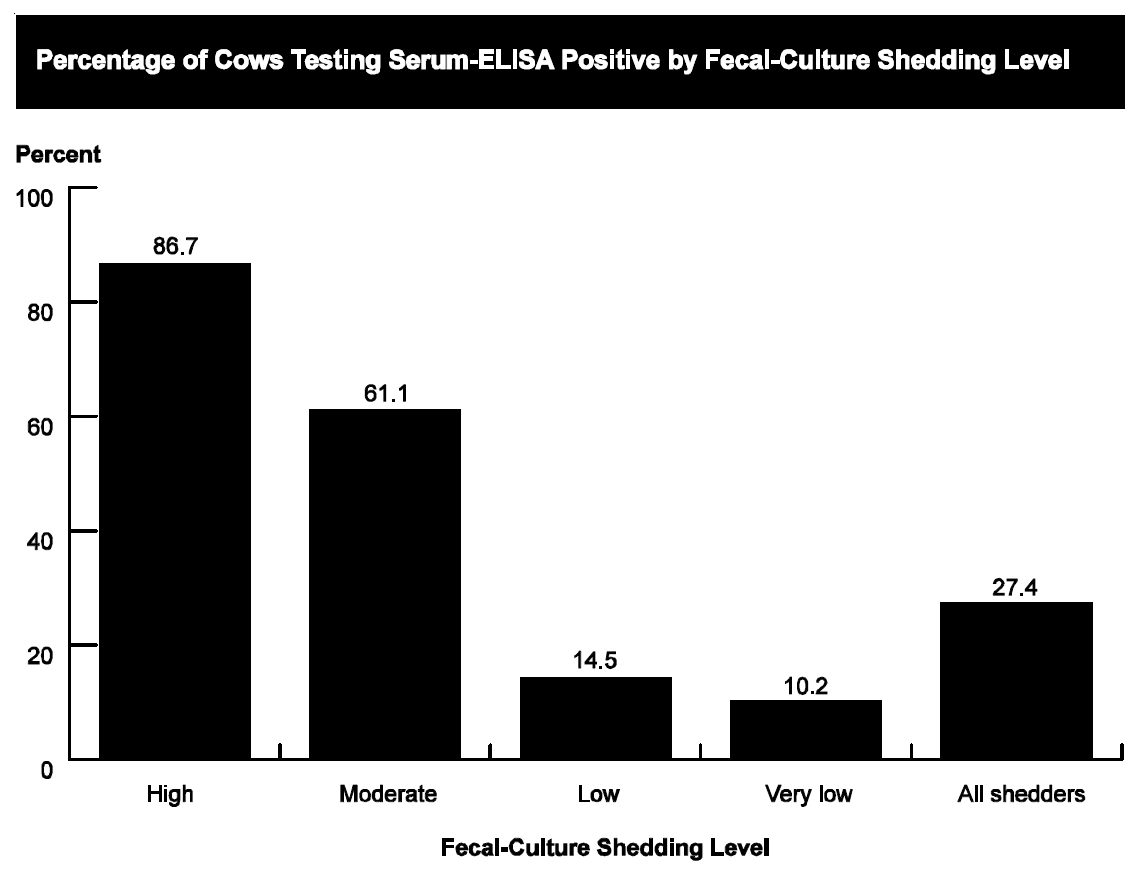
In 2002 the USDA did another study for the purposes of comparing Johne’s disease diagnostic test accuracy and evaluating within-herd infection prevalence but did not attempt to estimate the herd-level prevalence of Johne’s disease in the U.S. After testing 7,238 dairy cows, they reported that the ELISA done on serum detected only 27.4% of fecal culture-positive cows, showing that any survey done using ELISA methods underestimates the number of cows that are truly MAP-infected and shedding MAP in their feces, i.e. infectious. However, the ELISA was good at detecting the cows shedding the highest amounts of MAP in their feces.
In 2007 the USDA repeated the national survey of U.S. dairy herds but used environmental fecal culture on 6 samples per farm as the diagnostic test. That survey found that MAP was isolated from at least one environmental sample on 68.1% of operations, and herd-level prevalence was higher for larger herds. They reported: “About one-fourth of operations had six culture positive environmental samples. Operations with one to five culture-positive samples were less common. These results suggest that at least one-fourth of U.S. dairy operations may have a relatively high percentage of infected cows in their herds.” A clear relationship between herd size and frequency of finding MAP was shown.
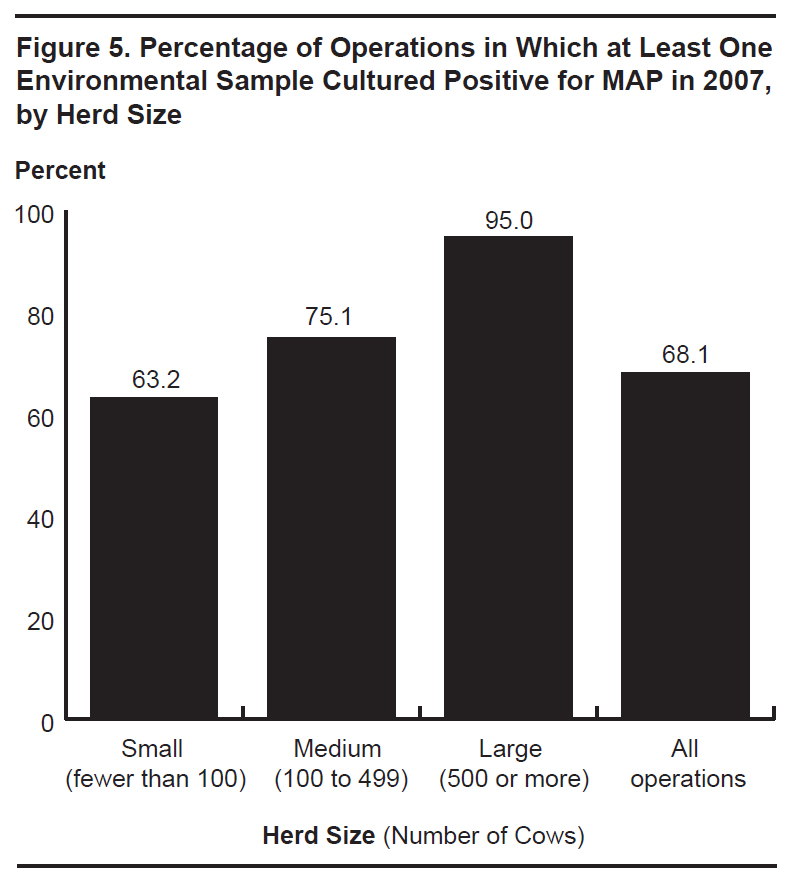
The rate of detection of MAP-infected herds is called the apparent prevalence (percentage of test-positive herds). Using this data, Dr. Jason Lombard et al. (Preventive Veterinary Medicine 108:234, 2013) used epidemiological methods to estimate the true herd-level prevalence or paratuberculosis in U.S. dairy herds at 91.1% of U.S. dairy herds (95% probability interval, 81.6 to 99.3%).
Comment: Chronic infectious diseases cause by slow-growing pathogens like MAP spread insidiously as herd owners buy and sell animals without considering the MAP infection status of the source herds. Although researchers have repeatedly tried to call attention to this problem, more acute or immediate challenges for dairy herd owners divert attention away from this growing problem. Early in the start of this epidemic clear warnings were issued:
“The aim of this bulletin is to call the attention of veterinarians and breeders to Johne’s disease, which, it is felt, is not recognized by many, in order that steps may be taken to prevent its introduction into still healthy herds, and to gradually eliminate it from affected herds.” (Beach & Hastings, 1922)
“Dr. V.A. Moore has compared the present position of Johne’s disease with that of bovine tuberculosis 60 years ago and has prophesied that, if not controlled, it may become a more troublesome scourge for future generations than tuberculosis is for the present generation of cattle-owners.” (Larson, et al., 1924).
Their warnings remain true today and their aim, to raise awareness, is the same aim as that of this website.
Below is my view of the global epidemic curve. If MAP is a zoonotic pathogen, the prevalence of this infection in food-producing animals does not bode well for the health of humanity.
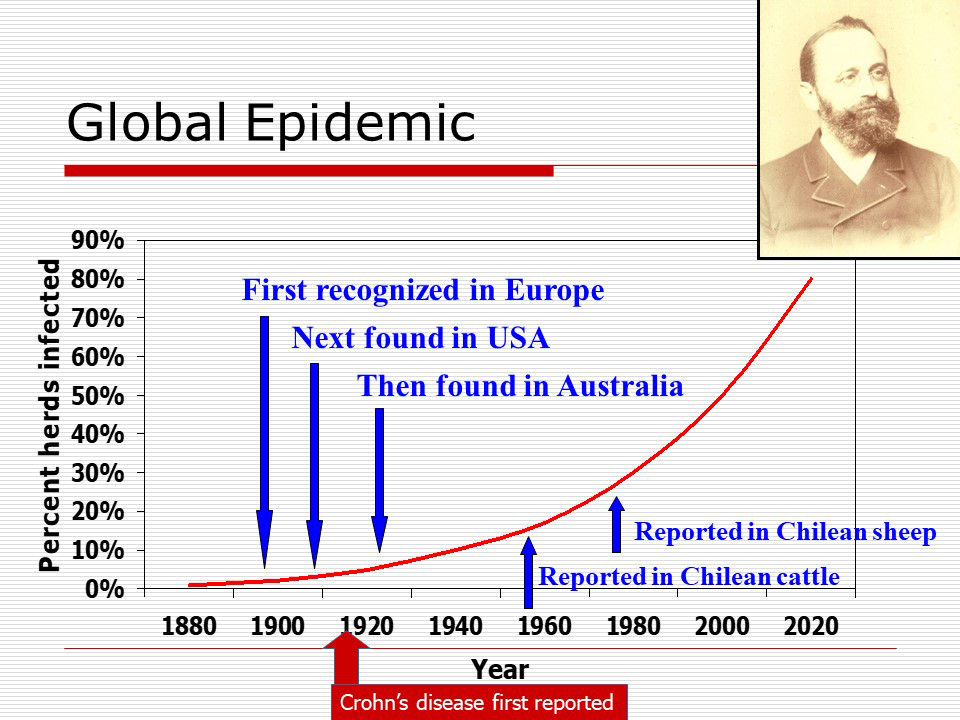
Explanatory note: Chilean reports of Johne’s disease are used as an example of how MAP is spreading to developing countries. The photo is that of Dr. H.A. Johne. For more on the history of Johne’s disease check out the history timeline.