
IS MAP ZOONOTIC? – WHAT DO VETS SAY?
2020-04-03 15:04:47Research Article
 Australia is a global leader in Johne’s disease control. They have developed control programs for a range of ruminant species and done some of the finest epidemiological research. They were the first to develop an ELISA kit for Johne’s disease, among many other firsts in the science of paratuberculosis.
Not surprisingly, Australia is now the first to systematically assess the perceptions of veterinarians regarding the zoonotic potential of MAP. This study was reported by members of the Sydney School of Veterinary Science, Faculty of Science, The University of Sydney in the Open Access journal Veterinary Sciences. They found that almost one-third of the respondents (32.2%) considered that MAP was likely to be involved in the causation of Crohn’s disease whereas more than two-thirds (69.8%) agreed with the adoption of the precautionary principle against Johne’s disease.
Abstract
Public concerns over exposure to Mycobacterium avium subspecies paratuberculosis (MAP) or MAP components via foods of animal origin could have negative trade consequences, despite the absence of conclusive scientific evidence of a causal association between MAP and Crohn’s disease (CD).
This study was conducted among Australian veterinarians to understand (a) their perceptions regarding the role of MAP in the causation of CD (an ordinal outcome), and (b) their consideration of the adoption of the precautionary principle against Johne’s disease (JD; a binary outcome). Ordinal and binary logistic regression analyses were performed to evaluate the association of explanatory variables with the above outcomes, respectively.
Almost one-third of the respondents (32.2%) considered that MAP was likely to be involved in the causation of CD whereas more than two-thirds (69.8%) agreed with the adoption of the precautionary principle against JD. Veterinarians who were concerned about exposure to and/or getting infected with MAP were more likely to consider MAP as a causative agent of CD (odds ratio: 7.63; 95% CI: 1.55, 37.63) and favor the adoption of the precautionary principle against JD (odds ratio: 6.20; 95% CI: 1.90, 20.25). Those perceiving MAP as a causative agent of CD were also more likely to favor the adoption of the precautionary principle against JD (odds ratio: 13.2; 95% CI: 1.26, 138.90).
The results suggest that Australian veterinarians, particularly those who consider MAP as a causative agent of CD are concerned about exposure to MAP and favor the adoption of the precautionary principle against JD. These findings can be useful for animal health authorities for designing JD control programs and policies.
Comments: This is the first formal survey of veterinary practitioners regarding the MAP zoonosis question. The article does an exceptional job of analyzing the data and underlying associations. Such as year of graduation, gender, and prior diagnosis of JD, related to veterinary opinions. I urge you to read the full Open Access article.
RAPID ID OF MAP BY MALDI-TOF
2020-03-27 14:44:21Research Poster
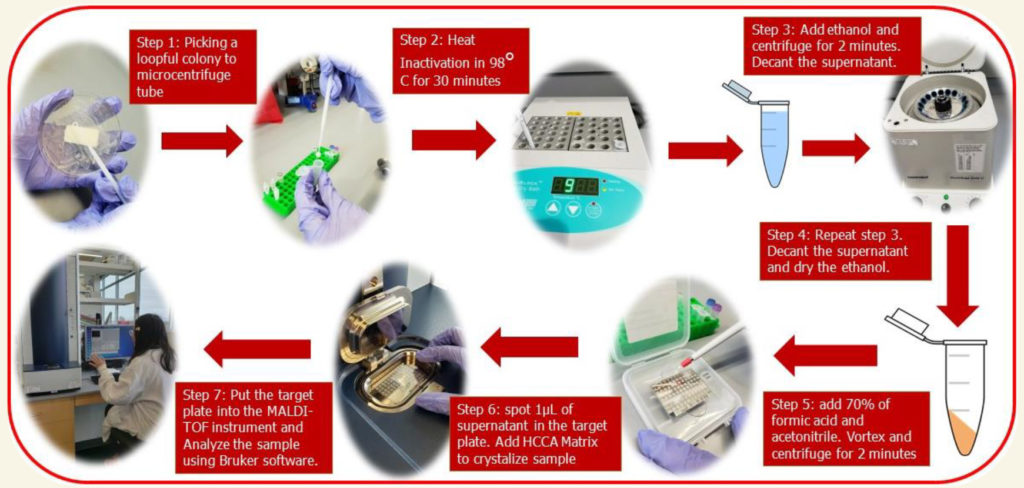
Undergraduate student, Claudia Antonika, at the University of Nebraska-Lincoln, under the direction of Dr. John D. Loy, in the School of Veterinary Medicine and Biomedical Sciences, evaluated the ability of the Matrix Assisted Laser Desorption/Ionization Time-of-Flight Mass Spectrometry (MALDI-ToF) to distinguish Mycobacterium avium subspecies paratuberculosis (MAP) from other members of the Mycobacterium Avium Complex (MAC), such as Mycobacterium avium subspecies hominissuis (MAH) and Mycobacterium avium subspecies avium (MAA) using the Bruker Biotyper MAlDI-ToF instrument (pictured below) and software. This research was presented as a poster at the University of Nebraska and is available here.

Results: MALDI spectral profiles evaluated by the Bruker Daltonics (BDAL) database only classified 20% (9/45) of M. avium subspecies correctly. In contrast, when the spectral patterns were matched against a new main consensus library (MSP database), 84% (38/45) of M. avium were accurately identified at the subspecies level, including 93% (26/28) MAP.
Conclusions: MALDI-ToF can improve the ability of labs to rapidly identify multiple M. avium subspecies. The new library database created in this project significantly enhances the specificity of the instrument as it increases the matching score values. Kappa analysis showed good strength agreement. Over 84% of the isolates could be classified correctly using our new MSP database, whereas current database BDAL only could identify 20% of MAC isolates. Although there were seven isolates that failed to have higher score values when using our MSP database, their top match values were still greater as compared to BDAL database score. Therefore, we consider that our new MSP database is a large improvement over the previous database.
Credits: This Poster is brought to you for free and open access by the UCARE: Undergraduate Creative Activities & Research Experiences at DigitalCommons@University of Nebraska - Lincoln. It has been accepted for inclusion in UCARE Research Products by an authorized administrator of DigitalCommons@University of Nebraska - Lincoln.
Comment: This is the largest study of MAP identification using MALDI-ToF, the current standard for bacterial identification in clinical microbiology laboratories. It provides an improved database with which to compare new M. avium isolates greatly improving identification accuracy. Moreover, it provides a new method for MAP identification that is independent of the genetics of MAP isolates, i.e. does not use genetic targets such as IS900 or HspX, to identify this M. avium subspecies. The only other main genetic-independent methods are: 1) exceptionally slow growth and 2) in vitro dependence on mycobactin for growth.
GOOD NEWS FOR CROHN’S
2020-03-20 14:00:32Research Article
![]() In prior clinical trials, all patients treated with anti-mycobacterial antibiotic therapy (AMAT) had been on standard anti-inflammatory drugs before being referred for AMAT, i.e. AMAT as second-line therapy. A new study by G. Agrawal from the Centre for Digestive Diseases, New South Wales, Australia (Prof. Thomas Borody, Director) reported for the first time a case series (8 patients) of treatment-naïve Crohn’s Disease patients treated with AMAT as first-line therapy. This OPEN ACCESS article was published March 6, 2020 in the journal Microorganisms, volume 8 issue 3 page 371.
In prior clinical trials, all patients treated with anti-mycobacterial antibiotic therapy (AMAT) had been on standard anti-inflammatory drugs before being referred for AMAT, i.e. AMAT as second-line therapy. A new study by G. Agrawal from the Centre for Digestive Diseases, New South Wales, Australia (Prof. Thomas Borody, Director) reported for the first time a case series (8 patients) of treatment-naïve Crohn’s Disease patients treated with AMAT as first-line therapy. This OPEN ACCESS article was published March 6, 2020 in the journal Microorganisms, volume 8 issue 3 page 371.
Abstract
Prospective trials of anti-mycobacterial antibiotic therapy (AMAT) have proven efficacious in Crohn’s disease (CD) but use as first-line treatment in CD has not been evaluated. This paper reports the outcomes of patients with CD treated with first-line AMAT. This paper consists of a case series of treatment-naïve CD patients who received AMAT as first-line treatment between 2007 and 2014 at a single center. AMAT treatment consisted of rifabutin, clofazimine and clarithromycin, plus either ciprofloxacin, metronidazole or ethambutol. Symptoms, inflammatory blood markers, colonoscopy and histology results, in addition to, the Crohn’s Disease Activity Index (CDAI) were tabulated from patients’ clinical records, and descriptive statistics were conducted. A Wilcoxon signed-rank test assessed the difference in CDAI scores before and while on AMAT. The statistical significance was set at 5%.
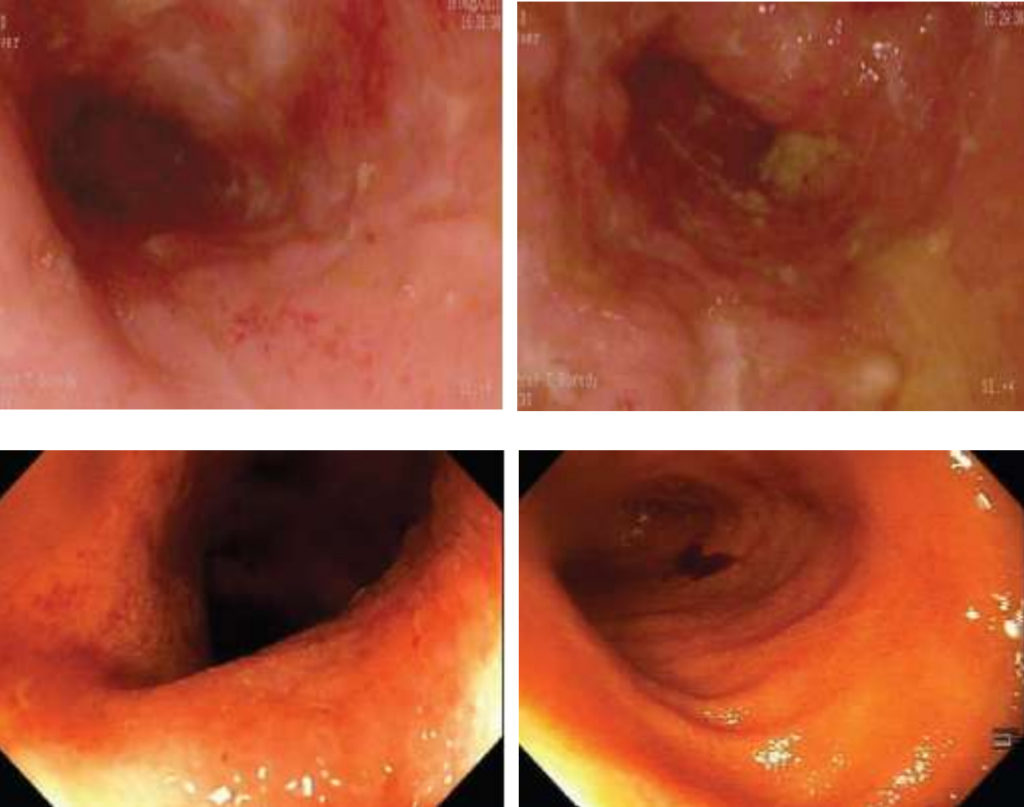
Clinical remission (CDAI < 150) with rapid improvement in clinical symptoms and inflammatory markers was seen in all eight patients receiving AMAT as sole therapy by 6 weeks. In all eight patients, the median CDAI score decreased significantly, from 289 prior to treatment to 62 at the 12-month follow-up (p < 0.001). Follow-up colonoscopies showed healing of CD ulcers, no visible mucosal inflammation, restoration of normal vascular patterns and complete mucosal healing on histology samples. AMAT as first-line therapy demonstrated a rapid improvement of Crohn’s disease (not previously seen when used as second-line therapy).
Author’s Conclusion
Our results dictate that future trials also examine AMAT as a first-line rather than rescue therapy. In addition, a four-drug combination is thought to be optimal, and AMAT’s decreased side effect profile and omission of immune suppression therapy make it a favorable option for a future pediatric study.
Comments: This case series adds further support to the hypothesis that MAP is a zoonotic pathogen and a cause of Crohn’s disease. It also gives hope to people suffering from this chronic debilitating disease.
TRIAL IMPLICATES MAP AS TREATABLE CAUSE OF CROHN’S DISEASE
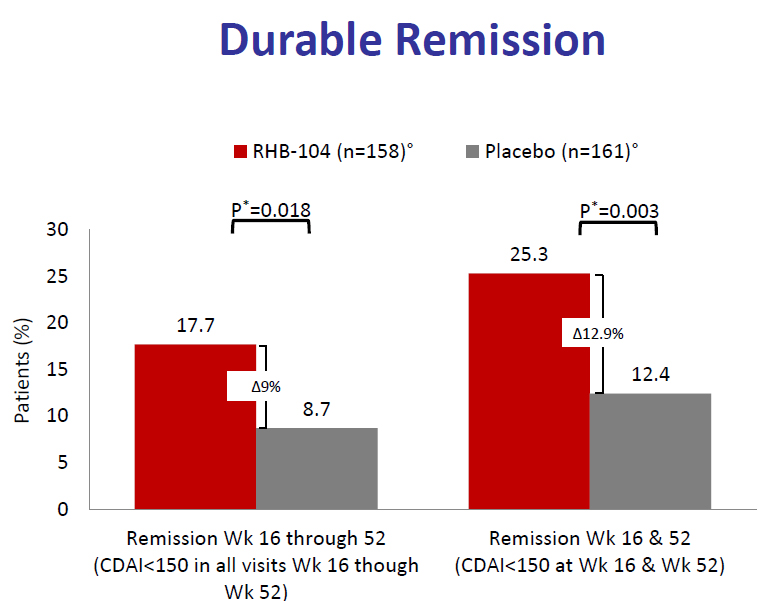
2020-03-13 16:39:01This is the title of a news item and editorial in Gastroenterology & Endoscopy News, March 10, 2020. This news item is important as it draws more attention from gastroenterologists to the very positive results of the RedHill Biopharma trial: results that have been previously discussed on this website. The key findings are again shown below which demonstrate that a combination of three antibiotics has significant therapeutic benefit to patients with Crohn’s disease.
What is troubling about this news posting are two concluding paragraphs quoted here:
David T. Rubin, MD, the section chief of Gastroenterology, Hepatology and Nutrition at the University of Chicago, called the data potentially “important,” but he emphasized that “we must adhere to Koch’s postulates” before drawing conclusions about the role of specific bacteria as causative agents in Crohn’s disease.
These postulates include proving the presence of the bacterium in every case of the disease and reproducing the disease when a culture of the bacteria is inoculated in a healthy host. No data of this kind—or even findings demonstrating MAP infection among enrolled patients—were presented, Dr. Rubin said.
Comment:
First, Koch’s Postulates are antiquated and many of today’s diseases cannot fulfill these simple criteria for causation developed in the early 1900s. I urge Dr. Rubin and others to read this book: Causation and Disease: A Chronological Journey by Alfred S. Evans (here’s a link to the book on Amazon). There are many examples of infectious diseases for which science cannot fulfill Koch’s Postulates and yet they are well-accepted causes of disease.
One of the best examples, pointed out by Dr. Robert Greenstein (Lancet Infectious Diseases, 2003), is the disease leprosy. We accept that Mycobacterium leprae is the cause of leprosy and yet no laboratory has ever cultured the bacterium in vitro. Read more on these Wikipedia pages about leprosy and about Hansen, the man most often credited with discovering the cause of leprosy (also called Hansen's disease) in 1873; a man whose career was destroyed after he tried to infect a human without her consent.
Bradford Hill Criteria for causality are a more contemporary framework for deciding if a specific infectious agent causes a disease. Dr. R.J. Chiodini, the first person to culture MAP from Crohn’s patients (Chiodini et al, 1984) judged that MAP fulfilled 8 of the 10 criteria for causality as defined by Bradford, Hill and others (Chiodini et al., 2012).
Here’s a short list of published findings implicating MAP, the accepted cause of Johne’s disease (JD), as a cause of Crohn’s disease (CD) and thus warranting a designation of MAP as a zoonotic pathogen:
- JD and CD are clinically similar.
- JD and CD share similar histopathology.
- All slow growing mycobacteria are zoonotic.
- The incidence of CD has been rising for decades; a pattern suggestive of an infectious disease.
- MAP is found by culture or PCR in CD patients more often than controls.
- CD patients have antibody to MAP more often than controls.
- CD patients have cell-mediated immune responses (CD4-reactive T-cells) to MAP more often than controls.
- Explants of human fetal intestine in SCID mice have been experimentally infected with MAP proving humans are susceptible.
- MAP causes infection and disease in nonhuman primates.
- Treatment of CD with anti-MAP antibiotics shows significant clinical and endoscopic improvement of patients (RedHill trial).
- Countries with the highest prevalence of CD are also countries with the highest prevalence of animals with JD.
- There are many ways humans are being exposed daily to MAP through food and water.
Closing Observation:
The header on the website of Lancet Infectious Disease today states:
With the increasing frequency of zoonotic spill overs leading to human infections and transmission, it’s apparent that pandemic preparedness has become a priority for the global health agenda.
Many experts agree that MAP is a zoonotic infectious disease that is spilling over from animals to humans, just like COVID-19. It is not recognized as such for many reasons, one being comments like that of Dr. Rubin, and another being that its spread is measured in decades, not days. It is a stealthy pathogen that society must reckon with.
Read more about the zoonotic potential of MAP on this page of our website.
JD CONTROL IMPROVES CALF HEALTH & DAIRY INCOME
2020-03-09 18:35:16 A research team in Guelph, Canada demonstrated the significant economic benefit to dairy farms working to control Johne’s disease and neonatal calf diarrhea. The analysis evaluated only changes to farm management (no diagnostic testing). Specifically, they evaluated changes to one or more of the following areas: (1) calf feeding, (2) maternity pen management, and (3) maternity area structure. These two diseases were investigated because control programs for one disease often work to control the other so herd owners get double the benefits when implementing control programs focused on changing farm management methods. This excellent article appeared in the January issue of the Journal of Dairy Science and is Open Access [21 pages with 52 references].
Abstract
The objective of this study was to perform a cost-benefit analysis (CBA) of a participatory extension model, called Ontario Focus Farms (FF), which was designed to facilitate the adoption of on-farm management practices to control Johne's disease (JD) on Ontario (ON) dairy farms. Partial budget models were developed to estimate the annual herd cost of JD on an average 78-cow Ontario dairy herd and the annual herd cost of neonatal calf diarrhea (NCD). With these estimates, a CBA was developed to assess the simulated net benefits of implementing various on-farm management scenarios (i.e., implementing 1, 2, or 3 of the following: calf feeding, maternity pen management, maternity area structure changes), where the benefits represent a reduction in the annual cost of JD and NCD. These models informed the final CBA assessing the net benefits of FF implementation over a 10-yr period. All monetary values are reported in Canadian dollars (Can$; where 1 Can$ = 0.823 US$ at the time of the study).
The annual herd cost of JD was estimated to be $3,242 ($41.56/cow), and that of NCD was estimated to be $1,390 ($36/heifer calf). When farms were expected to have both JD and NCD, all scenarios, when implemented over a 10-yr period, yielded positive net benefits ranging from $439 to $2,543 per farm when changes to maternity area structure were combined with calf feeding changes. These effects were sensitive to changes in level of disease (JD and NCD) on the farm, and the costs and effects of making changes. The NPV of making any on-farm change when JD was not present on the farm was negative. Overall, FF implementation yielded positive net benefits of $426,351 or $749,808, depending on whether a veterinarian or non-veterinarian served as the facilitator. The NPV was most sensitive to changes in burden of disease, the cost of implementing changes, and the proportion of FF participants that had JD and NCD on the farm. Benefits of FF implementation are also likely to accrue to veterinarians, as a result of professional facilitator training, and the Ontario dairy industry, as a by-product of improved milk quality and safety; therefore, the true net benefits of FF implementation are likely underestimated. Overall, the FF process should be considered an economically viable program and worthy of investment as part of a JD control strategy, as it demonstrates potential to yield positive net benefits for the Ontario dairy industry.
Conclusions from the publication: The total annual herd cost of JD to an average Ontario dairy farm, with a true within-herd prevalence of 10%, was estimated to be $3,242. The total annual herd cost of NCD to an average Ontario dairy farm, with an incidence rate of 23%, was estimated to be $1,390. Implementation of various combinations of calf feeding changes, maternity pen management changes, and maternity area structure changes resulted in varying net benefits in these simulations, depending on the presence of JD and NCD, the true burden of disease, and the specific management practices implemented. Overall, the implementation of the FF process over a 10-yr period yielded positive net benefits, suggesting that its implementation would be valuable for reducing the burden of JD and NCD on Ontario dairy farms.
Comment: As the authors mention, ensuring that producers follow the recommended control program consistently over time is a key factor in the realization of benefits. External farm advisers, such as veterinarians, are critical to this effort. Also, adoption of multiple management changes is most economically beneficial if the farm is dealing with both JD and neonatal calf diarrhea.
JD CASE REPORT: TAMIL NADU, INDIA
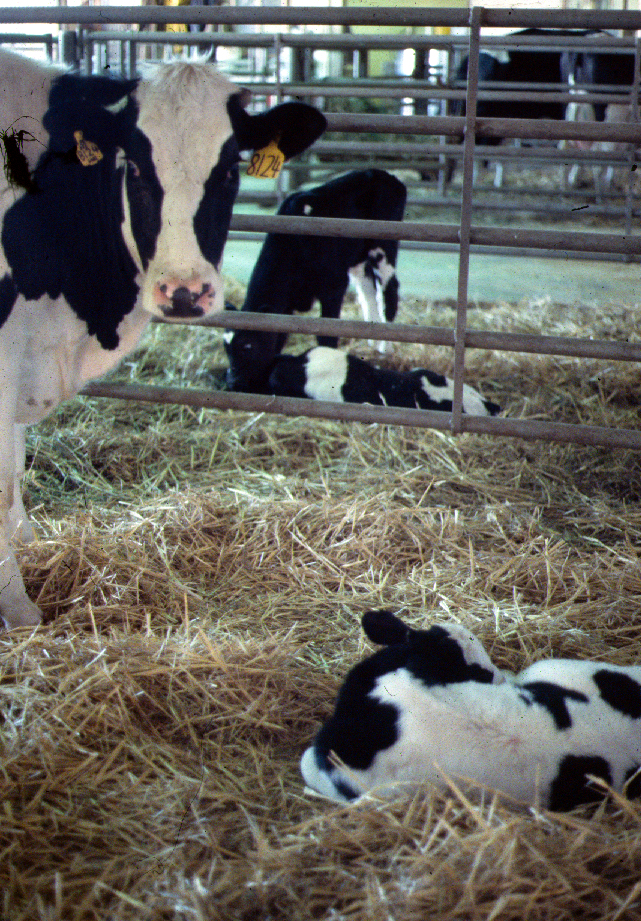
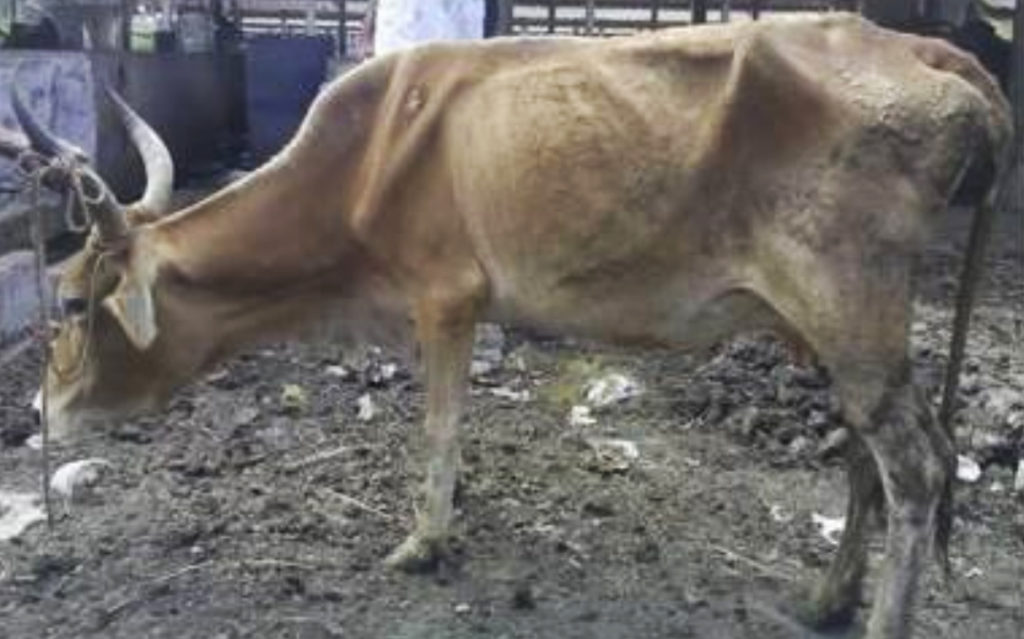
2020-03-01 21:29:14A. Karthikeyan and colleagues report on a case of Johne’s disease in the state of Tamil Nadu, India in the International Journal of Current Microbiology and Applied Science (volume 9, issue 1, pages 22-64-2267, 2020).
Abstract
 Johne’s disease (Paratuberculosis), a debilitating chronic granulomatous enteritis of domesticated and wild ruminants that causes huge economic and production losses to the dairy farmers. A six-year-old Jersey crossbred cow was presented with a history of chronic diarrhoea, gradual weight loss, reduction in milk yield and poor response to therapy. Based on history, clinical examination, Ziehl-Neelsen staining and IS900 polymerase chain reaction of the faeces the case was diagnosed as Johne’s disease. It warrants strict implementation of control measures to put off further spread Johne’s disease in dairy animals.
Comment: There are more cows in India than in any other country of the world. Cows have a special place in Indian society making Johne’s disease especially difficult to control in cattle.

Read more about sacred cows from Wikipedia: In the Hindu tradition, cows are honored, garlanded and given special feedings at festivals all over India. One is the annual Gopastami festival, dedicated to Krishna and cows.
The cow's nature is represented in Kamadhenu; the goddess who is the mother of all cows. In India, more than 3,000 institutions called Gaushalas care for old and infirm cows. According to animal husbandry statistics there are about 44,900,000 cows in India, the highest in the world. So while some old and infirm cows are treated in Gaushalas, the rest are generally abandoned at public places such as railway stations and bazaars.
Honoring the cow inspires in people the virtues of gentleness and connects them with nature. The cow gives milk and cream, yogurt and cheese, butter and ghee. The milk of a cow is believed to refine a person. The ghee (clarified butter) from the milk is used in ceremonies and in preparing religious food. Cow dung is used as fertilizer, as a fuel and as a disinfectant in homes.
The 16th International Colloquium on Paratuberculosis will be held at Amity University Rajasthan, Jaipur, India, October 17-21, 2022.
IRISH SURVEY FOR MAP IN CATTLE
2020-02-23 22:26:25Research Article
Elvira Ramovic and 9 colleagues reported a pilot study to assess the rate of MAP infection in Irish dairy and beef cattle herds, and much more. The abstract is below and the comments that follow discuss the dairy survey prevalence data specifically. The article is in the Irish Veterinary Journal and is Open Access.
Abstract
Background: Dairy and beef cattle can be reservoirs of many pathogens, including Salmonella and Mycobacterium avium subsp. paratuberculosis (MAP), the causative agent of Johne’s disease (JD). Farm environments may provide potential entry points for the transmission of infectious agents into the food chain. Antibiotics are used to treat a wide variety of infections on farms, and administration of antimicrobial agents to cattle is considered to be a driving factor for antimicrobial resistance (AMR). Control of JD and AMR are priority for animal health initiatives in Ireland. A national JD pilot programme was introduced by Animal Health Ireland in 2014, while the national action plan launched by Department of Health and Department of Agriculture, Food and Marine introduced in 2017 aims to improve the surveillance of AMR. The current investigation was undertaken as a pilot study to determine the proportion of herds positive for MAP, Salmonella species (Salmonella spp), commensal Escherichia coli (E. coli), Extended-spectrum beta-lactamase (ESBL) AmpC β-lactamase and carbapenemase-producing E. coli from 157 environmental faecal samples in Irish farms.
Results: MAP was detected in 10.2% of samples collected; on culture in 4 (4.9%) of the dairy herds and from 1 (1.3%) of the beef/suckler herds, and by PCR in 10 (12.3%) and 6 (7.9%) of these herds respectively. All culture positive herds were also positive by PCR. An additional 11 herds were positive by PCR only. Salmonella was not detected, while commensal E. coli were isolated from 70.7% of the samples (111/157) with 101 of these isolates shown to be fully susceptible to all antimicrobials tested. Of the 27 presumptive ESBL AmpC β-lactamase producing E. coli detected, one isolate was resistant to ten antimicrobials, nine isolates were resistant to nine antimicrobials, and four isolates were resistant to eight antimicrobials. Carbapenemase-producing E. coli were not isolated.
Conclusions: The results highlight the importance of monitoring farm environments for Johne’s disease. This disease is a growing concern for dairy and beef producers in Ireland, and sampling the farm environment may offer a useful means to rapidly screen for the presence of MAP. Non-pathogenic common enteric commensal and multiple-drug-resistant E. coli may contribute to AMR acting as a reservoir and transferring resistance to other species/pathogens in the environment.
Comment: As they say, “the devil is in the details”.
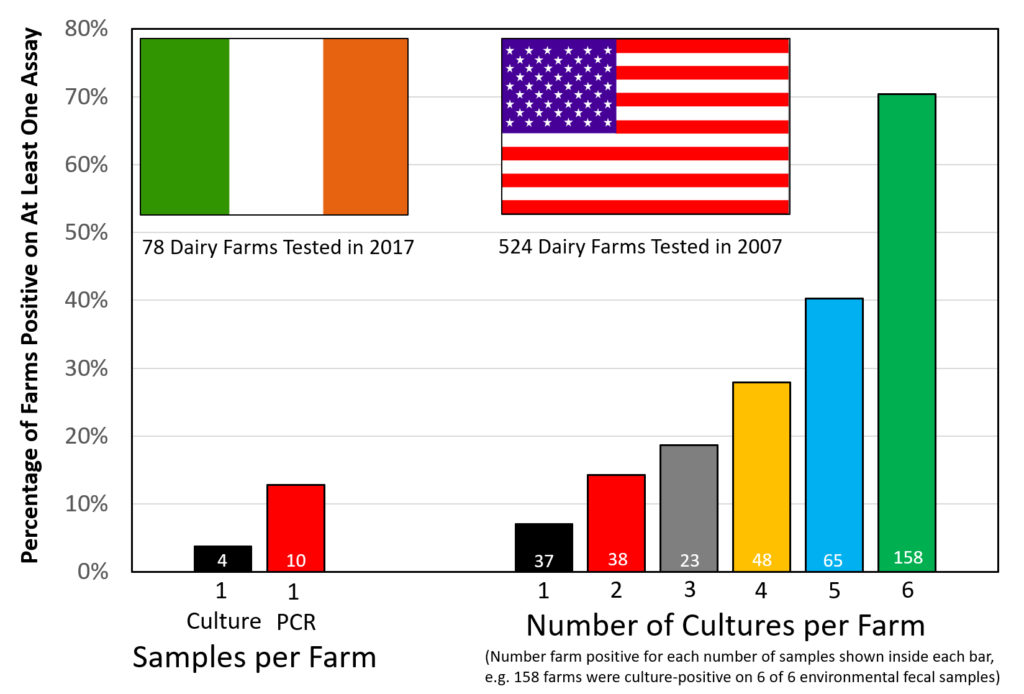
The above graphic contrasts the two similar surveys for MAP on dairy farms, both done using environmental fecal samples.
The Irish survey used culture methods on the first sample finding 4 farms positive of the 78 sampled (5.1%). The second sample was tested using IS900 PCR finding 10 of 78 (12.8%) positive. All 4 culture-positive farms were also PCR-positive. Were more farms detected because PCR is more sensitive, or because a second sample increases the chances of detecting an infected farm?
The US survey only used culture methods to judge the farm’s MAP infection status but collected 6 samples per farm. The US data indicates that: the more you look the more you find. Over 70% of US dairy farms had a least one culture-positive sample. From this Lombard et al. estimated the true herd-level MAP infection ate in US dairy herds to be 91.1%.
Clearly there are more MAP-infected farms in the U.S. than in Ireland, however, it is tricky to estimate just how many would have been detected if only 2 samples were tested, i.e. which 2 of the 6 tested samples would you count? I will leave that for the modelling experts. For the purposes of this news item it is not that important.
However, since this was a pilot study, it seems that a larger study is warranted that: 1) randomly selects farms, 2) uses PCR as the probably more sensitive and definitely more cost-effective diagnostic test, 3) measures the analytical sensitivity of the test based on spiked samples to better understand the accuracy of the measurement tool, and 4) collects more than 2 environmental fecal samples per farm.
For detection of MAP-infected dairy farms with a low infection prevalence, e.g. 0 to 12%, as in the Irish situation, Lombard et al. estimated the herd-level sensitivity of a single environmental fecal culture at 33.3% and two environmental fecal cultures at 44.4% (see Table 1 in Lombard, 2013). If Lombard et al. are correct, the Irish survey may have under-estimated the true MAP infection status of its dairy farms.
BUT to be fair - it was only a pilot study! (and nobody asked my opinion). :-)
MAP RISK FACTORS IN CHILEAN DAIRY HERDS
2020-02-17 21:16:45Research Article
Cristobal Verdugo, Maria Francisca Valdes, and Miguel Salgado from the Instituto de Medicina Preventiva Veterinaria, Facultad de Ciencias Veterinarias, Universidad Austral de Chile, Valdivia, Chile described herd level risk factors for Mycobacterium avium subsp. paratuberculosis (MAP) infection and clinical incidence in dairy herds in Chile. Their publication will appear in Preventive Veterinary Medicine, volume 176, March 2020 and is available online now (6 pages with 56 references). Unfortunately, it is not Open Access.
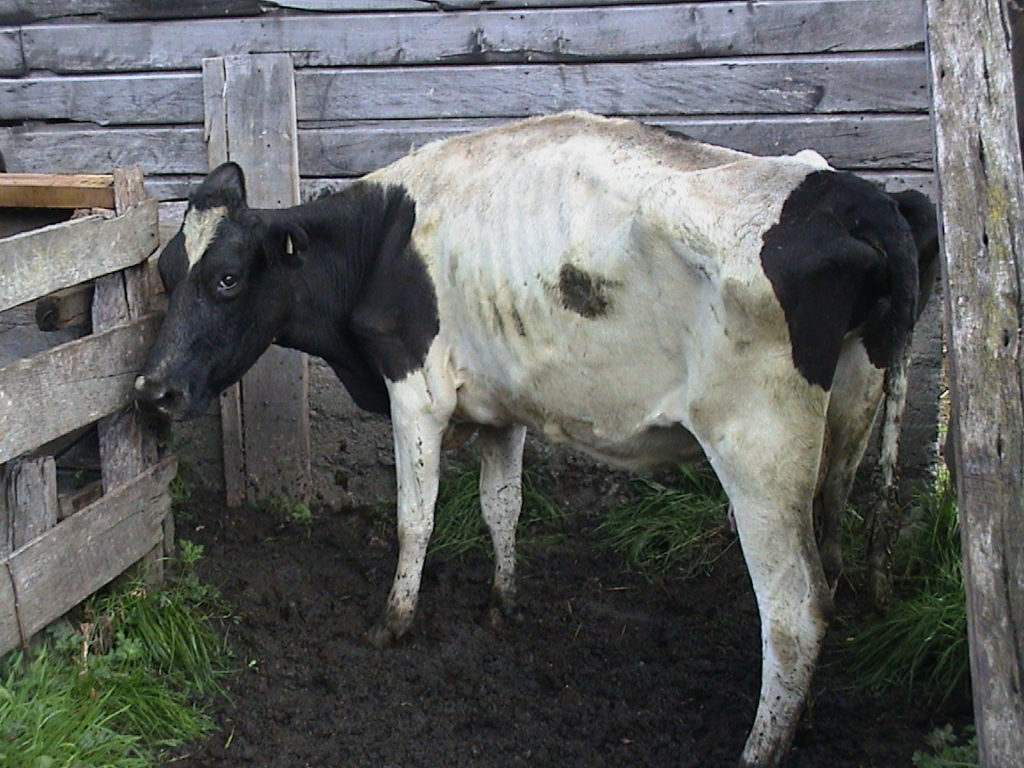
Holstein with clinical Johne's disease photographed in Chile by M.T. Collins.
Abstract
The study objective was to identify risk factors associated to: i) the infection by Mycobacterium avium subsp. paratuberculosis (MAP), and ii) paratuberculosis clinical incidence in Chilean dairy herds. A random sample of forty herds with previous history of MAP infection was selected. At herd level, all lactating cows were tested using a commercial ELISA kit. On the sampling date, a questionnaire gathering information on herd demographics, husbandry practices, and biosecurity measures was applied. Additionally, the farm manager/owner was surveyed regarding the number of paratuberculosis compatible clinical cases (CCC) in the last 12 months. Two Bayesian generalized linear mixed effect models were used to evaluate the association between the questionnaire data, and the proportion of truly infected animals (model 1) or the number of CCC (model 2).
A total of 4963 animals were sampled with an average apparent prevalence of 6.3 % (95 % confidence interval (4.0–8.0%). All sampled herds presented seropositive animals. Forty eight percent of the herds did not observe any CCC in the last year. Although, among those herd that did report CCC, a median of two cases per year was estimated. Model outputs showed that the proportion of truly infected animals and CCC reporting rates are associated to management practices. Specifically, positive associations were observed for feeding of calves exclusively with milk replacer, and the distance between the milking parlor and the calves’ barn. Additionally, CCC reporting rates were higher in farms that recently purchased animals, and where the distance between the milking parlor and the calves’ barn was less than 30 m.
Author’s Conclusions : “…the present research was able to find herd level factors associated to an increase in the risk of infection and the chances of reporting CCC. The reported factors put an emphasis on the need of introducing or improving basic biosecurity measures, especially in relation to the hygiene of calves, limiting the contact of young animals with manure from adult cows. The investment in such measures would not only be beneficial for MAP control but would improve the general health of the herd, possibly reducing the use of veterinary drugs.
Comment: The association of MAP infections with feeding calves milk replacer should be interpreted with caution. While milk replacer has been shown to harbor viable MAP (Grant 2017), it is also possible that preparation of the milk replacer on farms allowed fecal contamination which carried MAP into the re-hydrated product before feeding.
ON-FARM PASTEURIZER VS MAP
2020-02-10 20:28:23Research Article
K. Fechner and colleagues from the Department of Animal Sciences, Faculty of Agricultural Sciences, University of Göttingen reported about on-farm HTST (high-temp. short-time) pasteurizer's ability to kill MAP in the December 2019 issue of the Journal of Dairy Science. [not Open Access]
[caption id="attachment_3192" align="aligncenter" width="640"] HTST pasteurizer on a farm in Wisconsin[/caption]
Abstract
Feeding pasteurized milk to suckling calves is a popular practice used increasingly on dairy farms. Waste milk is frequently fed to calves because of its high nutritional value and economic benefits compared to milk replacement products. However, one of the disadvantages of feeding waste milk is the potential for exposure to a high number of bacterial contaminants, which may lead to serious illnesses or infections in calves. One of these contaminants is Mycobacterium avium ssp. paratuberculosis (MAP), the causative agent of Johne's disease (paratuberculosis). The transmission and distribution of paratuberculosis in dairy herds occurs mostly through the feeding newborn calves with contaminated colostrum or milk, because this age group is believed to be most susceptible to infection. To reduce the risk of transmission of pathogens, on-farm pasteurization of milk has become increasingly popular.
In this study, we analyzed the efficacy of a new commercial high-temperature, short-time pasteurizer (73.5°C for 20 to 25 s) in terms of MAP inactivation under experimental on-farm conditions. The pasteurizer uses a newly developed steam-heating technique, allowing for the pasteurization of the transition milk without clumping. In 3 independent trials, we spiked fresh raw milk samples to a level of 107 or 104 viable MAP cells/mL before pasteurization. We examined the thermal inactivation and viability of MAP using culture and a D29 bacteriophage-based assay. To verify the identity and number of MAP cells, we also performed PCR assays.
Pasteurization of the inoculated milk (107 and 104 MAP cells/mL) resulted in a remarkable reduction in viable MAP cells. The mean inactivation rate of MAP ranged from 0.82 to 2.65 log10 plaque-forming units/mL, depending on the initial MAP amount inoculated and the addition of conservative agents to the pasteurized milk. Nevertheless, approximately 103 MAP cells/mL remained viable and could be transferred to calves after high-temperature, short-time pasteurization of milk.
[caption id="attachment_3193" align="aligncenter" width="640"]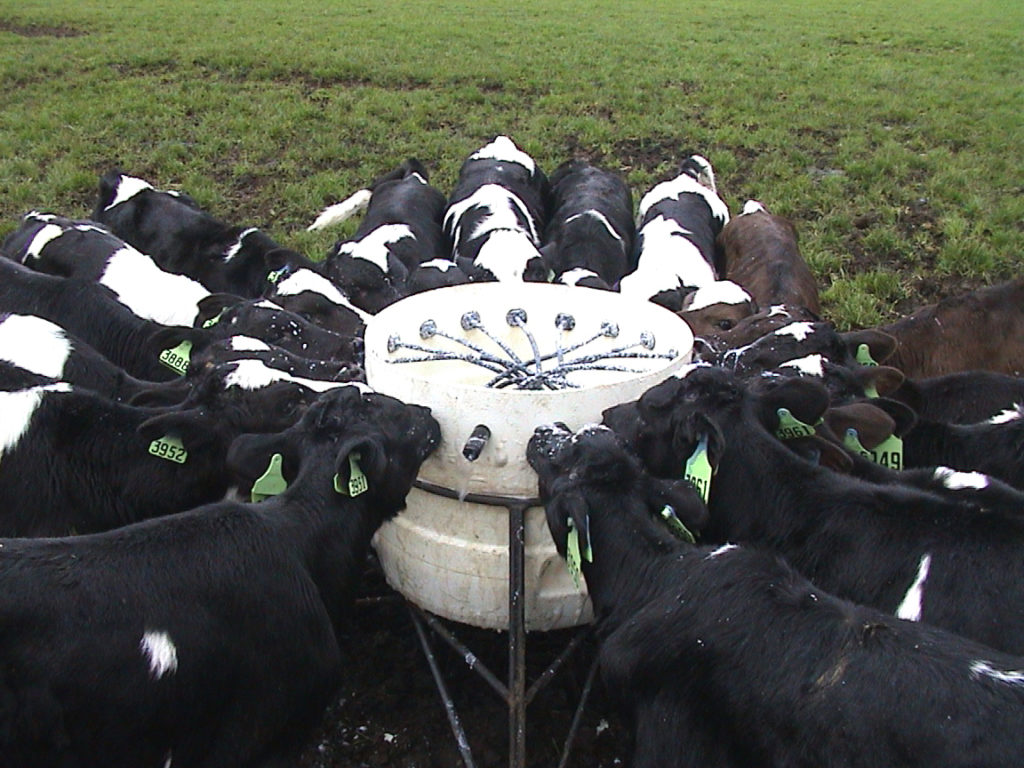 Milk: an effective way to transmit Johne's disease.[/caption]
Comment: Yet again, research has shown that HTST pasteurization [minimum: 161F (72C) x 15 sec] fails to reliably kill 100% of MAP bacteria. And, this study used a slightly higher temperature and longer time [73.5°C for 20 to 25 s]. Achieving 100% kill of MAP by pasteurization is primarily a function of temperature AND time AND the number of MAP in the raw milk.
Recent research by P. Steuer and colleagues in Chile reported finding up to 106 MAP/mL raw milk on Chilean dairy farms with ELISA-positive animals (see P. Steur et al., Is the transmission of Mycobacterium avium subspecies paratuberculosis (MAP) infection through milk intended to feed calves an overlooked item in paratuberculosis control programs?, Tropical Animal Health and Production (vol 52 issue 1, pp 89-94, January 2020).
Many explanations for the heat-resistance of MAP have been suggested, e.g. formation of clusters of bacterial cells (up to 100) hindering heat penetration, location inside host cells (protected), and perhaps most importantly the ability to form tenacious spore-like structures. For more on spore formation see Lamont et al. PLOS ONE, January 24, 2012.)
DAIRY: IMPACT OF DAM’S JD STATUS
2020-02-03 19:24:05Research Article
S. Patterson and colleagues in the UK reported on the impact of a dairy cow’s Johne’s ELISA status on the likelihood her calf will also be MAP-infected (ELISA-positive). Their study is reported in the journal Preventive Veterinary Medicine (in press, corrected proof, available online – not Open Access).
Abstract
Johne’s disease, caused by Mycobacterium avium subsp. paratuberculosis (MAP), is a chronic condition of dairy cattle, and is endemic in the UK. Lack of understanding of the relative importance of different transmission routes reduces the impact of control scheme recommendations.
The long incubation period for Johne’s disease makes evaluation of control schemes difficult, and so this long-term cohort study offers a rare and valuable insight into the disease epidemiology. A longitudinal study was carried out following a cohort of 440 UK dairy cows in 6 herds recruited in 2012-2013. Individuals entering the milking herd were routinely monitored for the presence of MAP using quarterly milk ELISA testing. Using a Cox proportional-hazards regression model the relationship between time until first detection of infection and dam MAP status was investigated. We then compared the magnitude of the effect of dam status with that of other risk factors in order to understand its relative importance.
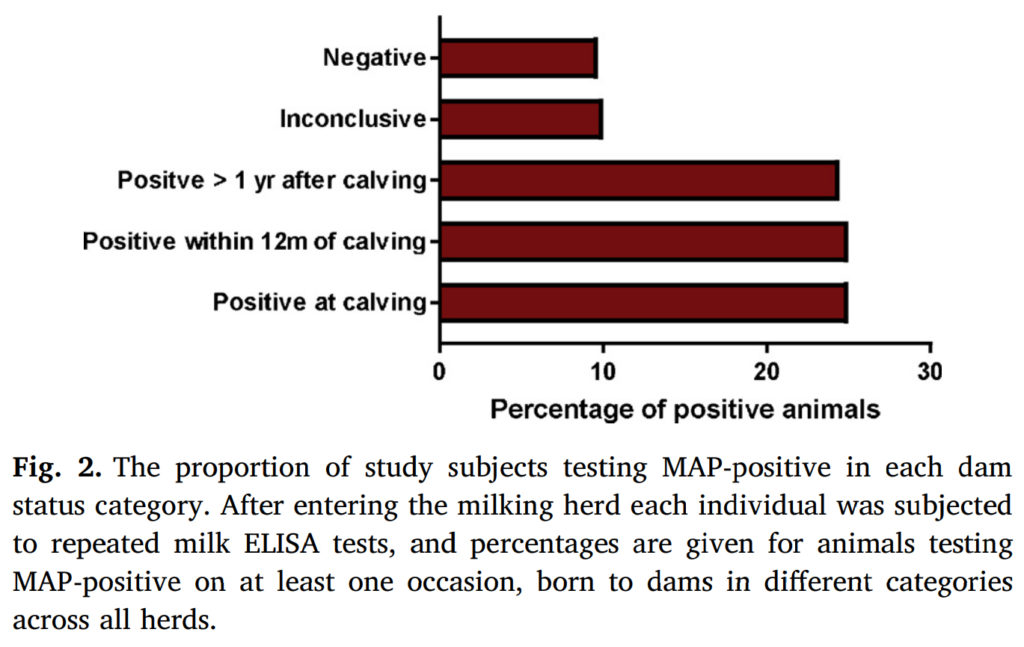
Dam status was found to be the only observed factor that was significantly associated with time to an individual testing MAP-positive (p = 0.012). When compared to negative dams, we found a marginally significant effect of having a positive dam at time of calving, that increased the hazard of an individual testing positive by a factor of 2.6 (95% confidence interval: 0.89–7.79, p = 0.081). Further positive associations were found with dams becoming positive after the birth of the subject; a dam seroconverting within 12 months post parturition being associated with a 3.6 fold increase in hazard (95% confidence interval: 1.32–9.77, p = 0.013), and dams seroconverting more than a year after calving increased the hazard by a factor of 2.8 (95% confidence interval: 1.39–5.76, p = 0.004).
These results suggest that cows may be transmitting MAP to their offspring at an earlier stage than had previously been thought, and so raise important questions about how this transmission may be occurring. The results of the study may have important practical implications for the management on-farm of the offspring of MAP-positive animals, with the potential to vastly reduce the time required to eliminate this chronic disease.
Comment: For faster control of Johne’s disease in dairy herds it is advisable to tell herd owners not to retain as herd replacements any heifer born to a cow that tests positive for Johne’s disease. This study supports that recommendation (using ELISA as the Johne’s disease test) and extends it to include calves born to cows that test positive AFTER calving. Not culling calves born to test-positive dams will result in more MAP-infected heifers entering the herd as replacements and then infecting more calves thereby slowing progress of a control program. That said, in my experience it is difficult enough to get herd owners to act on positive test results on cows, much less act on the probabilities that their calves are also infected. Hopefully, this report and others like it will help to strengthen culling recommendations to include calves born to ELISA-positive dams resulting in more successful control of Johne’s disease in dairy herds.
« Previous 1 … 9 10 11 12 13 … 18 Next »